Tracking and analyzing Facebook Ads campaign results isn’t just a routine step when running Facebook Ads—it’s the key to optimizing your budget and maximizing ROI. But how do you do it effectively? Join NEMI Ads to discover the best strategies for your campaign!
What is Facebook Ads Campaign Results
Your Facebook Ads campaign results give you a complete picture of how well your ads are performing. By analyzing these insights, you can determine whether your campaign is on track to meet its goals and make necessary adjustments to improve efficiency.
While monitoring performance is crucial, how often you should check your results depends on factors like campaign objectives, budget, and ad quality. In general:
- Right after launching the campaign to ensure it’s reaching the right audience.
- Regularly, to track overall performance and spot any unusual fluctuations.
- After making changes to the campaign to measure their impact.
- During key moments, such as holidays or major shifts in Facebook’s advertising policies.
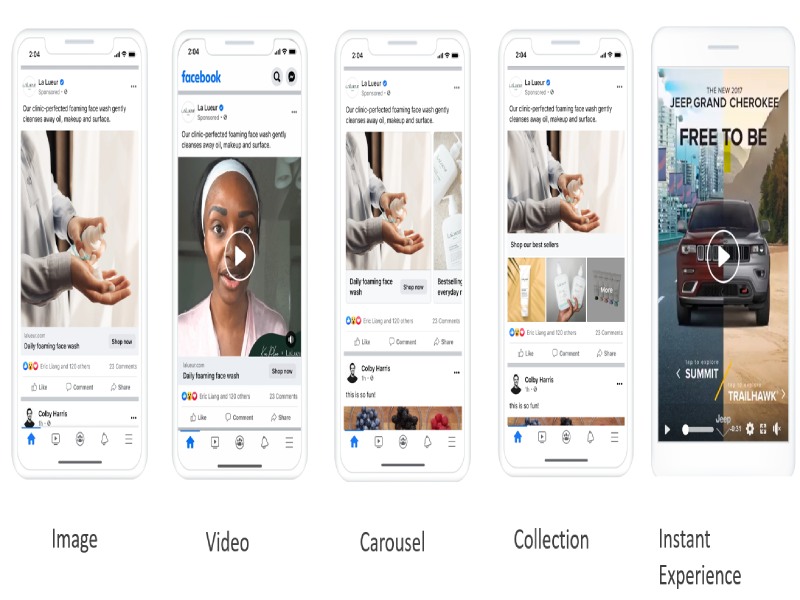
How to View Results on Your Facebook Ads?
To effectively track your campaign’s success and evaluate your Facebook Ads Campaign Results, focus on key metrics like:
- Reach – The number of people who saw your ad.
- Impressions – The total number of times your ad was displayed.
- Click-Through Rate (CTR) – The percentage of people who clicked on your ad compared to its total impressions.
- Cost Per Mille (CPM) – The cost for every 1,000 ad impressions.
- Conversion Rate (CR) – The percentage of users who took a desired action after clicking the ad.
- Cost Per Click (CPC) – The amount spent for each click.
- Return on Ad Spend (ROAS) – The revenue earned for every dollar spent on ads.
To access these insights, follow these steps:
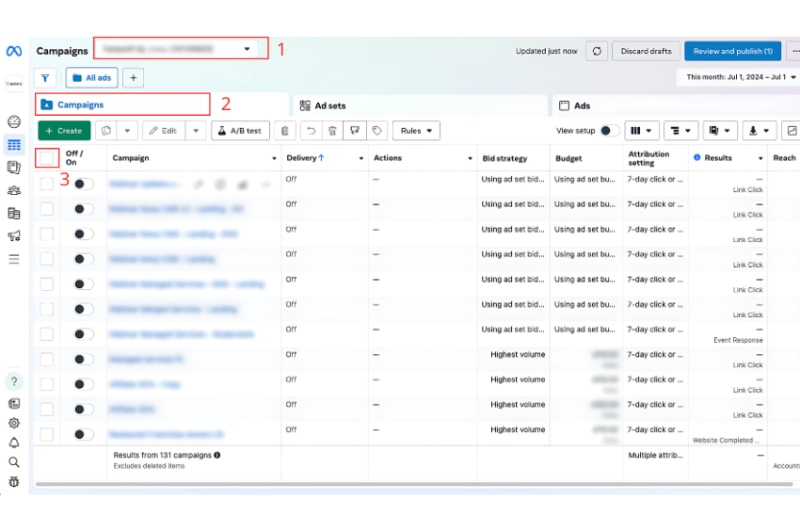
- Open Facebook Ads Manager.
- Navigate to the Campaigns, Ad Sets, or Ads tab.
- Select the campaign, ad set, or specific ad you want to analyze.
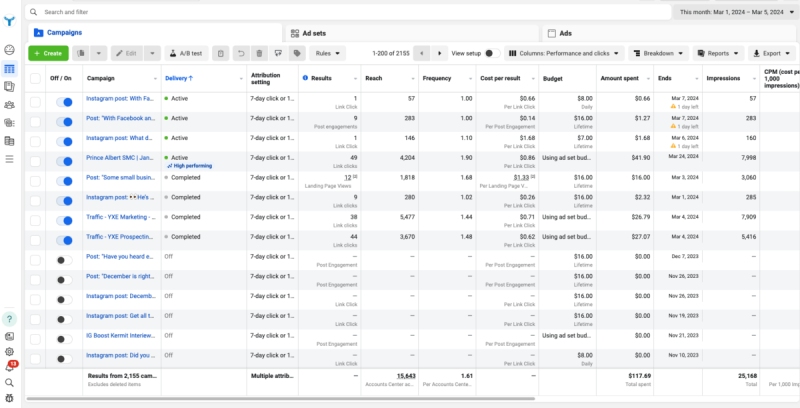
- A detailed breakdown will appear, showing essential data such as budget, reach, impressions, cost per result, and total ad spend.
What are good results for Facebook Ads?
Success in Facebook advertising isn’t defined by a single number—it depends on factors like industry standards, competition, and your specific campaign goals. That said, here are some general benchmarks based on data from Save My Leads:
- CTR: A rate between 2-5% is considered strong, indicating that your ad content and visuals are engaging.
- CR: A well-performing campaign typically has a conversion rate of at least 10%.
- CPC: While a lower CPC is ideal, it should be evaluated alongside other metrics to ensure budget efficiency.
- ROAS: A ratio of 4:1 or higher (meaning every $1 spent generates at least $4 in revenue) is often seen as a sign of strong performance.
To truly gauge your ad’s success, consider these metrics within the context of your campaign’s objectives and industry benchmarks.
3 Tips to Analyze Facebook Ads Campaign Results Effectively
Manage Data with Ad Reporting Columns
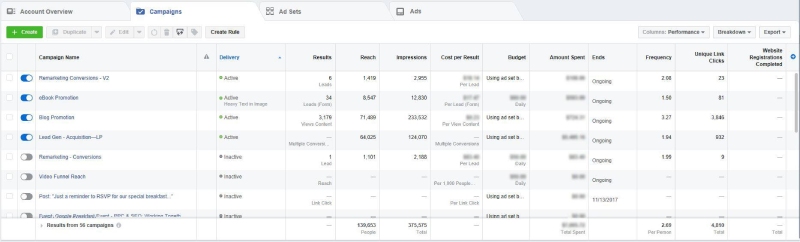
By default, Facebook Ads Manager only displays basic metrics such as reach, impressions, and a few key performance indicators. While these numbers provide a general overview, they may not be enough to fully assess your campaign’s effectiveness.
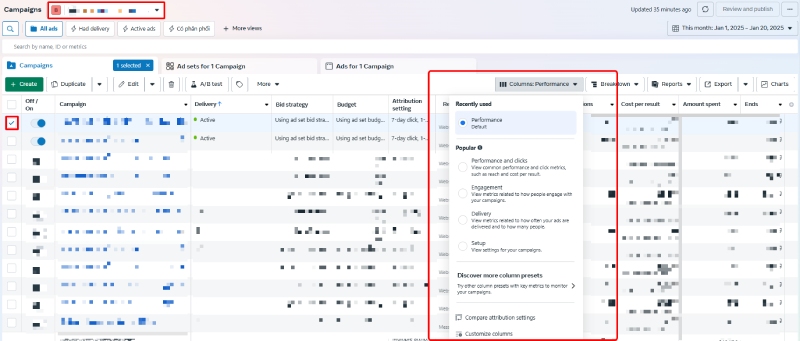
To gain deeper insights and accurately measure your return on investment, you need to gather more comprehensive data. The best way to do this is by using the Columns menu to customize your reports.
With this feature, you can easily adjust and refine your report by selecting additional metrics such as ad frequency, landing page interactions, video engagement, sales, and more. If the system doesn’t display the information you need, simply click “Customize Columns” to access more detailed and specific data.
Use Advanced Reporting for Campaign Analysis
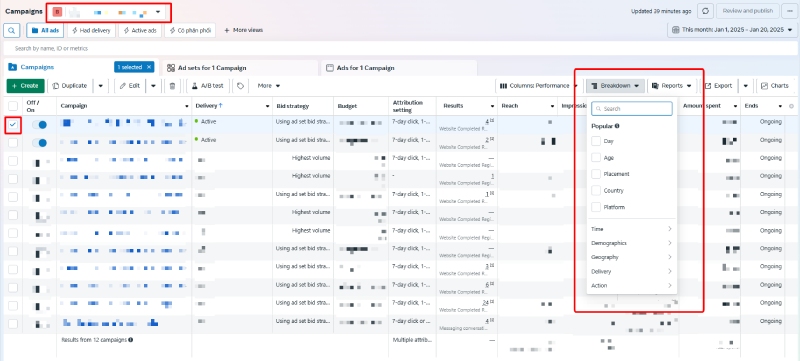
With Breakdown, you can analyze performance by age, gender, location, and other demographic factors. It also provides insights into which placements, platforms, and devices generate the best results. Additionally, you can track performance by time of day or day of the week, helping you identify peak engagement hours. For example, if your ads perform better on mobile devices in the evening, you can adjust your scheduling and content strategy to maximize conversions.
To use the Breakdown tool, follow these steps:
- Select the campaign, ad set, or ad you want to analyze.
- Click the Breakdown button.
- Choose from categories such as Time, Demographics, Geography, Delivery, or Actions.
Once selected, the system will display detailed insights based on your chosen breakdown parameters.
Save and Automate Campaign Reports
Consistently tracking campaign performance is essential for long-term success. However, manually creating reports repeatedly can be time-consuming.
To streamline the process, use Meta’s Ads Reporting tool. This feature provides all the necessary data to manage your campaigns efficiently. You can also create custom reports from scratch, applying filters, sorting data, and using advanced functions to tailor your reports.
Follow these steps to generate a report:
- Log into Facebook Ads Manager.
- Click the Reports dropdown menu.
- Select Create New Report.
- Scroll to the Report Analysis section and click Ads Report.
- Choose the metrics and data points you want to include in the report from the customization panel on the right.
Tracking and analyzing your Facebook Ads campaign results isn’t just about reviewing numbers—it’s the key to optimizing your budget and boosting conversion rates. By mastering essential metrics, leveraging performance analysis tools, and implementing data-driven optimizations, you can significantly improve your ad campaign’s effectiveness.
We hope this guide helps you confidently analyze your Facebook Ads performance. Stay tuned to NEMI Ads for more valuable insights and updates!